Looking to Sell Your Property?
Begin your journey with a free property valuation. Get the facts and figures to make informed decisions.

The Newark property market can often feel far more frantic than it actually is.
Every week, new “For Sale” boards pop up on your street. It’s easy to look at a neighbour’s house, think, “They only moved in a few years ago,” and immediately head to Rightmove or Zoopla to nosey at the interior photos and check the asking price. A few months later, the “Sold” sticker goes up, new neighbours move in, and the cycle repeats.
Yet, beneath this highly visible activity sits a quiet majority. A massive portion of Lincoln’s housing stock hasn’t changed hands for years—even decades.
To understand what is actually driving the property market in Newark, we analyzed Land Registry data between 1995 and 2026 to uncover the truth behind this “two-speed” local market.
Across the city, there are 55,389 homes. Of those, 15,607 have recorded at least two sales over the last 30 years.
This means just 28.2% of Newarks’s entire housing stock is responsible for the repeat-sale activity we see day-to-day. While this is slightly higher than the UK national average of 25.5%, it proves a critical point: the perceived buzz in the local market is generated by a relatively small pool of highly active properties.
Newark Active Stock vs. Inactive Stock (1995 – 2026)
[████████░░░░░░░░░░░░░░░░░░░░] 28.2% Sold 2+ Times
[████████████████████████████] 71.8% Sold Once or Never
Among the properties that sold at least twice, the average gap between recorded house sales was 1,989 days—approximately 5.5 years.
Important Data Note: This 5.5-year figure does not represent the average length of homeownership for every resident in Newark. Instead, it measures the turnover rate specifically for the high-activity section of the market that moves frequently.#
Not all property types behave the same way within the Newark housing stock. The frequency of a home returning to the market is heavily influenced by its property type and buyer demographics:
The city-wide average hides some fascinating hyper-local trends. Here is how repeat-sale
| Postcode District | % of Homes Sold 2+ Times (Since 1995) | Average Turnover Gap (Years) |
| NG22 | 25.1% | 5.5 Years |
| NG23 | 25.9% | 5.5 Years |
| NG24 | 30.9% | 5.3 Years |
The data shows that properties in the repeat-sale category had an average latest recorded sold price of £269,648. By comparison, the estimated average value of all homes across Newark stands at £273,698.
At first glance, this £4,000 gap suggests that more affordable homes circulate through the market faster. However, these Newark house prices require context. A “latest recorded sale” for a repeat property might have occurred a few years ago, whereas the overall average reflects current market valuations. Even with that caveat, smaller, entry-level homes clearly dominate the market’s churn.
The most intriguing takeaway from this data isn’t the homes changing hands—it’s the staggering volume of property that stays completely still.
Of Newark’s 55,389 homes:
This means a massive portion of Newark’s residents are living behind front doors purchased in the 1970s, 1980s, or early 1990s. They have watched their streets evolve, families grow, and local property values skyrocket—all without ever putting up a “For Sale” board of their own.
While roughly a third of these non-moving properties are council or housing association homes, thousands are privately owned.
In a future article over the coming weeks, I will dig deeper into the Newark homes that have never recorded a sale since 1995, separate the social housing from the privately owned homes and explore just how many local households may have been living behind the same front door for more than 30 years. Because sometimes the most interesting story in the property market is not how often people move.
It is how many never move at all.
If you are planning a move and want an honest, evidence-based assessment of your home’s current value in today’s market, the team at Walters can help. To maintain our high standards of direct, personalized customer service, we strictly limit our listings to 20 properties per month.
Our July and August valuation slots are currently open. You can book your professional market appraisal online at Walters Property / Valuation or speak directly with Emma our local expert by calling us on 01636 521 111.
Begin your journey with a free property valuation. Get the facts and figures to make informed decisions.

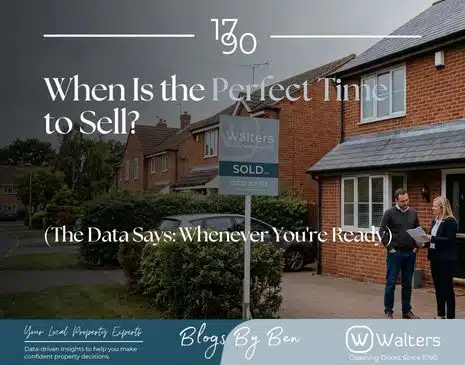
Quick Answer: According to 10 years of Rightmove data, February is statistically the best month to list a UK home, with 68.9%
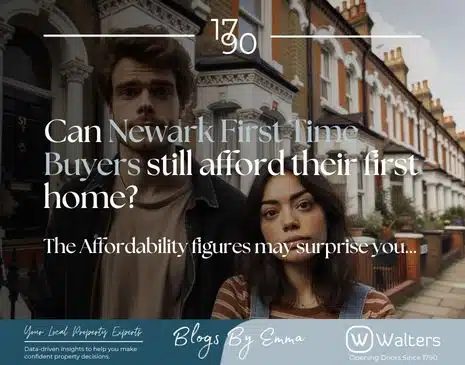
The reality of housing affordability in Newark may surprise you. Ask almost anyone on the high street whether first-time buyers can still
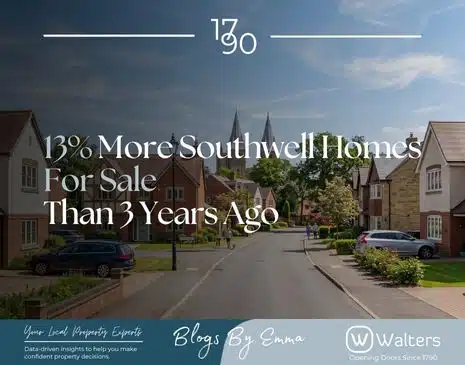
The Southwell residential property market has shifted over the past three years. Across the NG25 postcode sector, prospective buyers now ...





"*" indicates required fields
"*" indicates required fields


